Dealing with errors on your WordPress site can be a real hassle, especially when the cause of the error isn’t apparent. These issues have a way of disrupting your workflow, leaving you looking for a simple way to identify the root of the problem.
Fortunately, there’s a tool designed to help with exactly this: the WordPress debug log. This file provides detailed insights into your site’s errors, making it much easier to identify and fix them.
We have used the WordPress debug log to troubleshoot various errors. In this article, we’ll walk you through the ins and outs of the debug log effectively, so you can keep your site running smoothly.
The WordPress debug log is a powerful tool that helps diagnose and fix site issues efficiently. Before editing core files, make sure to use a backup plugin to backup and protect your site data.
What is a WordPress debug log?

The WordPress debug log is a tool that keeps track of errors and warnings on your site. Think of it as a diary that records any bumps in the road your website encounters. This log can be incredibly helpful when you’re trying to figure out why something isn’t working right.
You can find this file in the wp-content directory, and it’s called debug.log. To get it up and running, you’ll have to tweak your wp-config.php file.
The WordPress debug log captures details like PHP errors, notices, and warnings, all with timestamps, so you can see exactly when things went wrong. This makes it a must-have for developers and site managers who need to diagnose and fix issues efficiently.
Just remember, because the log can contain sensitive information, it’s important to keep it secure and out of the wrong hands. By using the debug log effectively, you can keep your website running smoothly and avoid unexpected hiccups. Let us now look at how you can enable it.
How to enable WordPress debug logs
Enabling the WordPress debug log is a handy way to track down issues on your site. Here’s how you can do it:
Step 1: Access the wp-config.php file
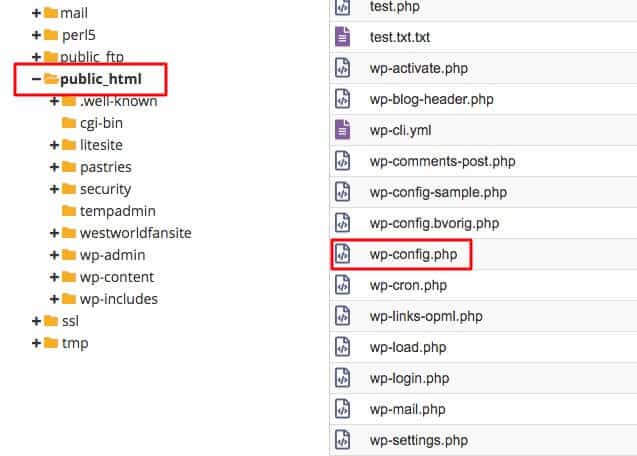
Your first task is to locate the wp-config.php file. This is a crucial file for your WordPress setup, holding all the important configuration details. You can find it in your site’s root directory, often public_html or www. To access it, you can use FTP, the hosting provider’s file manager, or cPanel, depending on what you’re comfortable with.
Step 2: Open the file with a text editor
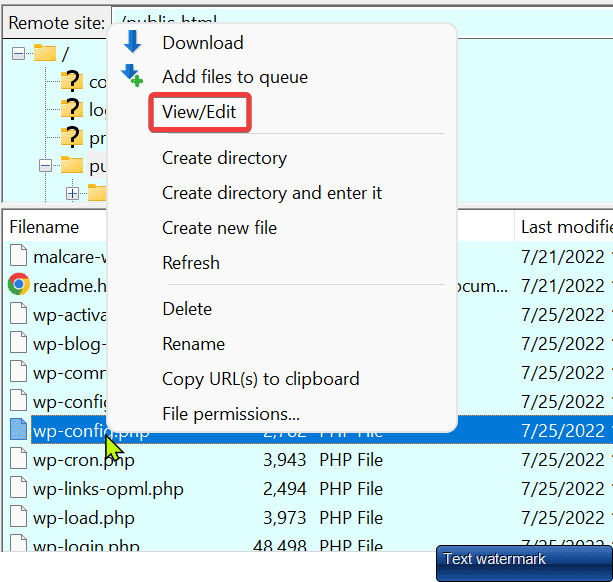
Next, open the wp-config.php file using a text editor like Notepad to view and edit the file.
Step 3: Activate debugging mode
Now, we’ll turn on the debugging mode. Add the following line of code to the file:
define('WP_DEBUG', true);

define('WP_DEBUG_LOG', true);

define('WP_DEBUG_DISPLAY', false);
By default, errors might show up on your website for everyone to see, which isn’t ideal. Adding define(‘WP_DEBUG_DISPLAY’, false); keeps them hidden from visitors.
Step 4: Save and upload
If you’re editing the file locally, save your changes and upload the file back to the server using FTP.
How to disable debugging
Keeping debugging active on a live site can expose sensitive information and slow down performance. So it’s best to disable it once you’re done troubleshooting. To turn off debugging, simply swap the codes you added earlier to:
define('WP_DEBUG', false);How to access the WordPress debug log
Accessing the WordPress debug log is simpler than you might think. Here’s a step-by-step guide to help you navigate the process effortlessly.
Step 1: Get to your WordPress files
To start, you’ll need to access your WordPress files. You can do this using an FTP client, your hosting provider’s file manager, or cPanel. Both methods get you to the same place, so choose whichever one you’re more comfortable with.
Step 2: Navigate to the wp-content directory
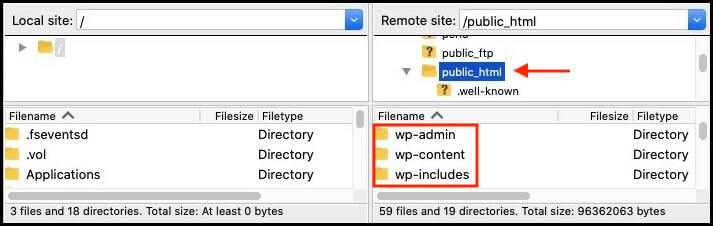
Once you’re in, make your way to the wp-content directory. It is within the root directory. This is where WordPress stores a variety of important files, including the WordPress debug log.
Step 3: Find the debug.log file
In the wp-content folder, look for a file named debug.log. This file contains all the error messages, warnings, and notices that have been logged.
Step 4: Download and open the file
If you’re using FTP, download the debug.log file to your computer so you can view it locally. Use a simple text editor like Notepad or TextEdit to open the file. This will allow you to see all the details, including timestamps that tell you when each issue occurred.
Troubleshooting errors with WordPress debug logs
Using WordPress debug logs to troubleshoot errors can be a game-changer for your site’s health. Let’s look at how you can make the most of this tool.
Step 1: Identify error messages and codes
Start by looking through your debug.log file to spot specific error messages and codes. These messages are like clues, helping you understand what’s going wrong.
Step 2: Match errors to plugins or themes
Next, analyze the context within the log. Often, errors are tied to specific plugins or themes. Recognizing this can point you toward the source of the problem.
Step 3: Check file paths and line numbers
The log will show you file paths and line numbers—use these to zero in on exactly where the error is happening in your WordPress files.
Step 4: Test fixes in a staging environment
Before making changes to your live site, test any fixes in a staging environment. This way, you avoid potential disruptions that could affect your visitors.
Step 5: Monitor for confirmation
After applying solutions, keep an eye on the debug log to ensure the issue is resolved and no new problems pop up. This ongoing check helps maintain your site’s stability.
Best practices for debugging
Keeping your debug process smooth and effective involves some best practices:
Enable debugging mode only when needed: This conserves your site’s resources, preventing unnecessary strain.
Secure your debug log: Set correct file permissions to restrict unauthorized access.
Regularly review the log: Make it a habit, especially after updates, as part of your routine maintenance.
Clear outdated entries: This prevents the log file from becoming too large, keeping it manageable.
Keep everything updated: Ensure WordPress, themes, and plugins are updated. This is to avoid compatibility and security issues.
Parting thoughts
The WordPress debug log is a key tool for diagnosing and resolving site issues swiftly. It provides crucial error information that helps keep your site robust and functional. Regular monitoring is important for maintaining site health.
Always secure the log file and use a staging environment for testing. Follow best practices and stay proactive.
Importantly, take a complete backup of your site before editing the wp-config.php file or using the debug log. Backups safeguard your data and settings, ensuring a smooth and secure WordPress experience.
FAQs
Where is the WordPress debug log?
The WordPress debug log is located in the wp-content directory as a file named debug.log. You can access it via an FTP client or your hosting provider’s file manager.
How can I see WordPress logs?
To view WordPress logs, access your hosting provider’s dashboard to find server-level access and error logs. Additionally, plugin-specific logs, such as those for security or caching plugins, can often be found within the plugin settings or their respective directories.
How do I see PHP errors in WordPress?
PHP errors in WordPress can be viewed in the debug.log file after enabling debugging in the wp-config.php file. Look for PHP-related entries in the log.
How to fix an error in WordPress?
To fix an error in WordPress, first identify the error through the debug log. Then, search online for solutions or consult official guides, and test fixes in a staging environment.
What is WP_DEBUG_LOG?
WP_DEBUG_LOG is a setting in the wp-config.php file that directs WordPress to write error messages to the debug.log file. This helps when you are troubleshooting.
What is the 500 error code?
The 500 error code is a server-side error indicating something went wrong on the server, causing the site to be unable to display the requested page.

Shivani enjoys crafting guides that make every aspect of using WordPress simple and easy to follow. When she's not glued to her laptop, you can find her buried in a good book or occasionally, painting.